
- Alongside the Jurisdictions view in the pokerfuse PRO Directory, online poker networks and companies have their own data.
- This article explains the data for online poker networks.
- The individual network data typically has six tabs. The Overview tab provides a short description, the cash game traffic rankings of the network by regional market and company.
- Oter tabs allow various views of traffic data and market share, together with links to articles and Newsbeats tagged to the network.
Alongside the Jurisdictions view in the Poker Industry PRO Directory, online poker networks and companies have their own data. This article explains the data for online poker networks.
Directory data is constantly updated and expanded to provide a resource that PRO Data subscribers can use for marketing and industry analysis.
Accessing the PRO Directory
Clicking on the Directory icon in the top of screen menu bar leads to the Directory page. Directory data for networks is accessed by clicking on the red “Networks” tab at the top of the page.
The top table lists all the currently active poker networks, and below is a table listing networks which are no longer active.
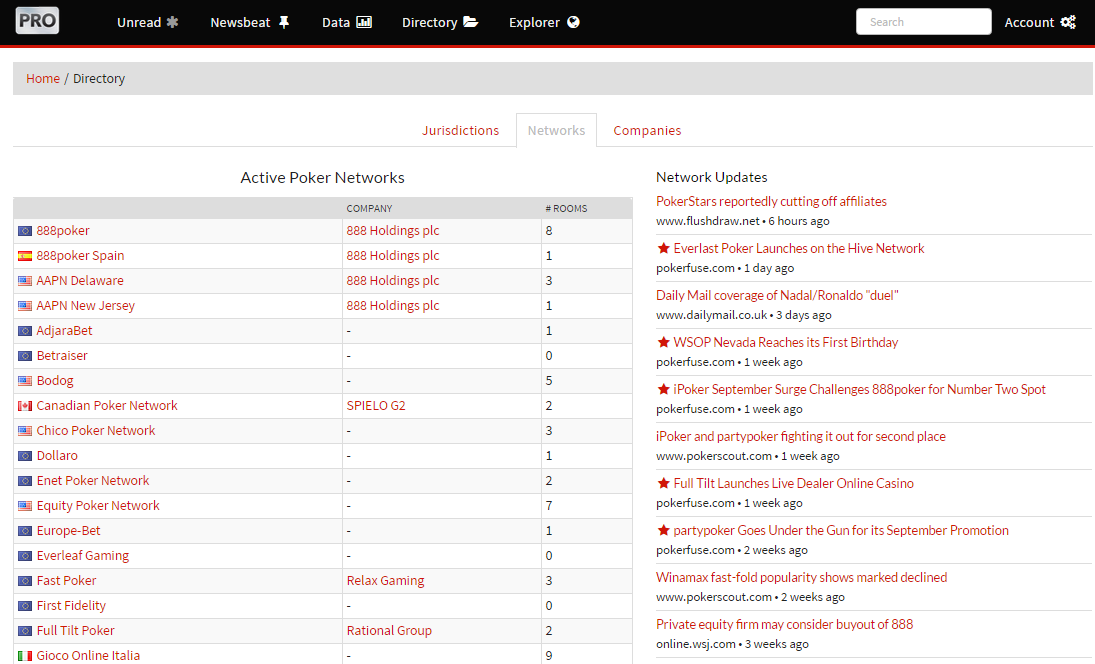
At the right is a stream from Poker Industry PRO News and Newsbeats related to the listed networks.
Click on the network name highlighted in red to get access to the specific network data—clicking on the company name in the second column links to the Companies data for the company which runs the network.
Network Data
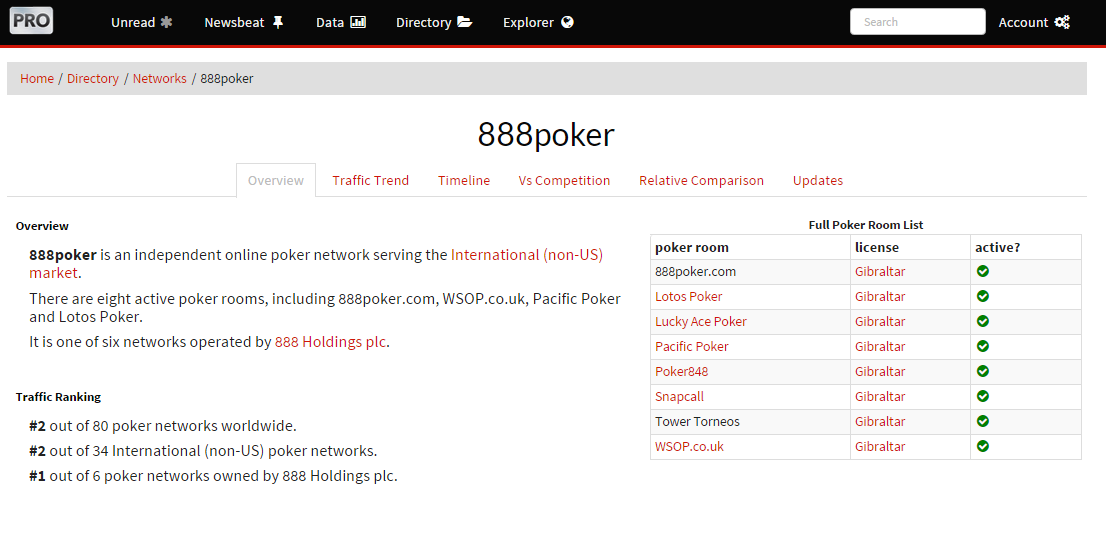
The individual network data typically has six tabs. The Overview tab provides a short description, the cash game traffic rankings of the network by regional market and company.
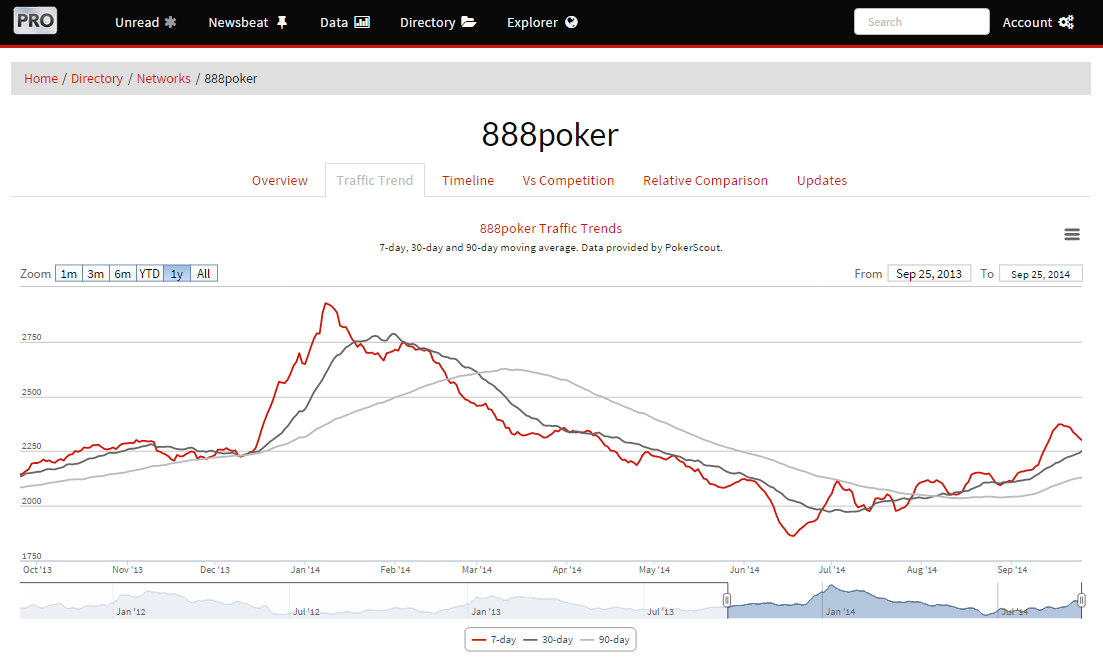
The Traffic Trend tab shows cash game traffic measured by 7-, 30- and 90-day moving average. The Timeline tab shows a seven day moving average view of cash game traffic with links to Poker Industry PRO articles, superimposed. Newsbeat articles tagged to the network are superimposed on the date axis.
The date range for both graphs can be changed either by using the pre-set options at the top right of the graph, or by entering a specific date range in the boxes at the top left.
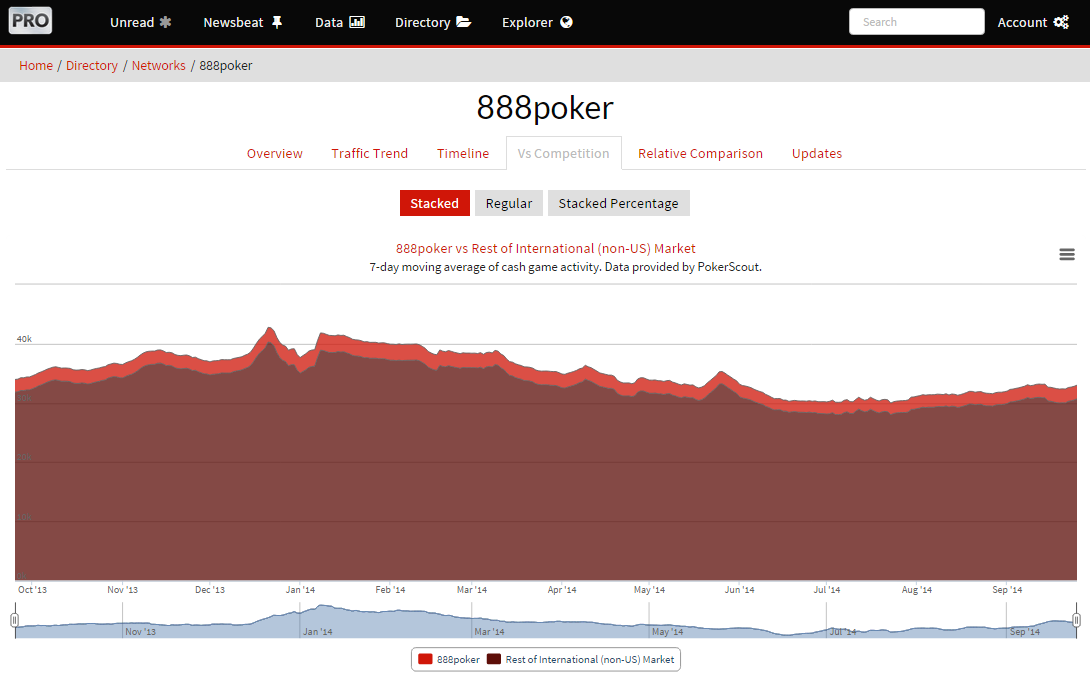
The Vs Competition tab provides a view of the network’s cash game traffic over the last 12 months compared to the market where the network operates. Three views are available: Stacked, Regular and Stacked Percentage.
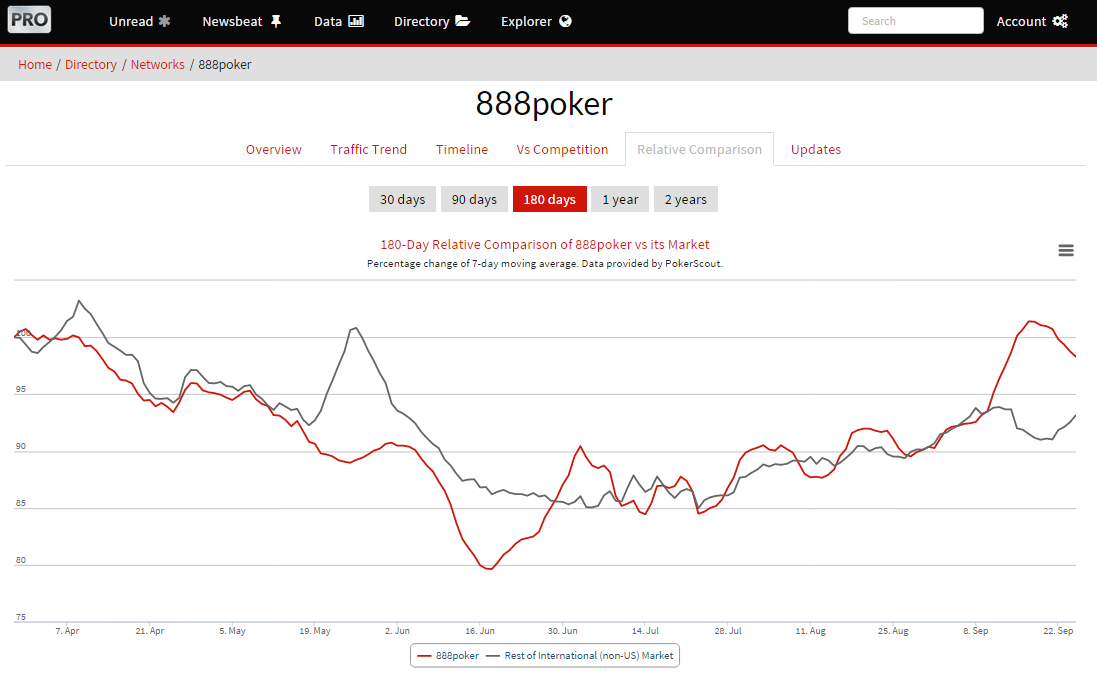
The Relative Comparison tab provides a comparison with the market which can be viewed over different pre-set time periods, from 30 days to two years.
As always, the final Updates Tab provides a list of articles tagged to the network which have appeared recently on Poker Industry PRO. A list of the most recent relevant Newsbeats is presented to the right.

Older articles and other relevant data can be searched for using the Poker Industry PRO Explorer feature.