One of my favorite handicapping innovations in the past decade is the TRAKUS information available for a select group of tracks. Racetracks utilizing the Trakus software have a small transponder in the saddle cloth of each horse which acts as a GPS and measures the exact position and distance run for each horse in the race. At the end of the race, many Trakus tracks will display the exact distance, in feet, that the winning horse covered as well as the +/- distance from the winner for everybody else.
Trakus was originally invented and utilized for other sports, the first being the NHL. Trakus technology was used in the broadcast of the 2001 NHL All-Star game and skills competition and has also been used for NASCAR broadcasts, until 2002 when the company decided to shift their focus to horse racing.
Get a $100 sign up bonus at twinspires.com
You can always tell when a track uses Trakus. The live broadcast of the race shows the floating numbers, aka “chicklets”, tracking the horses’ transmitted positions at the bottom of the screen. A partial list of Trakus tracks contains Aqueduct, Belmont, Del Mar, Santa Anita, Gulfstream, Churchill Downs, Keeneland, Saratoga, Woodbine, et al. A veritable who’s who of North American Racing.
For those of us who like to utilize trip handicapping and tirelessly pour over charts and replays looking for extra wide trips as well as perfect trips, Trakus makes life a heck of a lot easier and much more quantifiable.
Anyone who has ever run track knows that the shorrtest way around the track is to be as close to the inside as possible, and this mathematical certainty holds true in horse racing as well. Every lane farther to the outside adds extra distance, especially around the turns. Even when a horse travels on the outside in the stretch, they have covered extra ground to get to that position. The rule of thumb in horse racing is that for every path off the rail a horse travels on a turn, the horse loses 1 length, plus the energy required to travel that extra distance. This extra energy in coverfing the extra ground can really ompound the effects of a wide trip and make a horse’s outing look a lot worse than it really was. In a sport where victory is often measured in inches, the exactness of the Trakus data seems like a monumental handicapping tool.
In 2014, The Daily Racing Form published a study of 2-turn turf races at Gulfstream and Saratoga where horses who covered 40 feet more than the winner and finished within 4 lengths of the winner were tracked in their next start. Using no other handicapping criteria they found that 29% of the horses who met this criteria won their next start with an average payout of $9.98 and a positive ROI of $2.90. If that’s not impressive I don’t know what is!
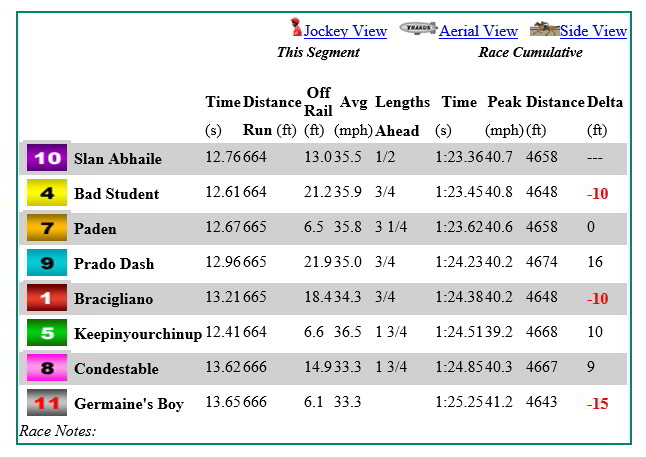
The following is a sample Trakus chart from a random race at Churchill Downs. To me, the most important column is the one on the far right which shows the distance traveled by each horse relative to the winner.
Get a $100 sign up bonus at twinspires.com
After reading the DRF study and utilizing Trakus information, my only question is….why isn’t this information more widely available and used by every horseplayer out there? For now, perfect Trakus information is merely a pipe dream. According to a 2012 DRF.com article by the great Andy Beyer, “The company’s priorities seem misplaced – typical of the racing industry, which often doesn’t seem to understand its customers. Trakus has put a lot of effort into developing graphic simulations of races that (Trakus) says are aimed at a younger generation that loves video games. But the company has not focused on giving racing’s core customers the accurate information that they want.”
In an industry that is so data dependent we can see the holy grail on the horizon, but when will the day come when we can easily use it? I hope that day is soon.